Do you want your students to actually understand transformations rather than just following the steps? You’ll need to do more than just assign a function transformations worksheet.
The best way to learn math is through discovery and reflection. Even though students are often resistant to making mistakes, it is clear that math concepts stick when students are able to work through the problems and make observations.
These digital discovery graphing activities challenge your students to make observations about different transformations that occur when changes to each part of a function changes.
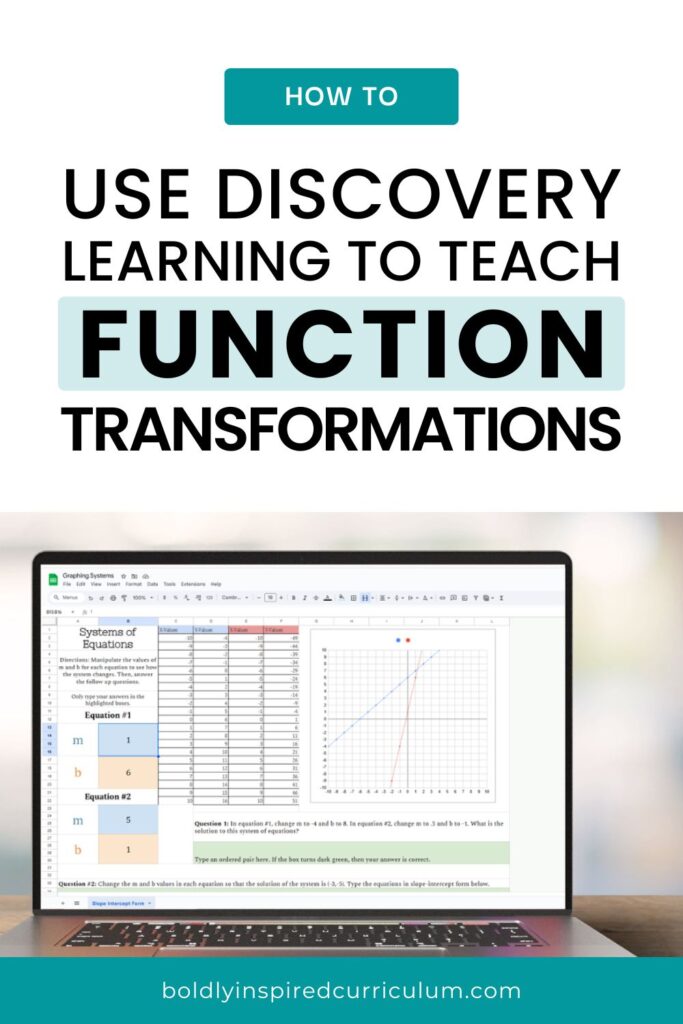
Table of Contents
ToggleHow It Works
Your students will change the values of each part of the functions to see the effects on a graph. These activities are set up to show the following function transformations:
- Vertical and horizontal shifts
- Horizontal shifts
- Reflections over the x and y axes
- Vertical and horizontal stretches
- Vertical and horizontal compressions
The entire Google Sheet is editable and pre-coded to change the y-values based on the different inputs. These activities are perfect for introducing transformations of graphs, group/center work, or sub plans.
Your students will change the values of a, h, and k and see how the graph transforms with each change. They will see the effects of making the “a” value a negative number or a fraction and how changing h and k affects the vertex of the graph.
Your students will watch the parabola transform as they change the values of a, h, and k in vertex form. They will make observations about the location of the vertex and whether the parabola is compressing or stretching based on the “a” value.
This transformations activity introduces end behaviors of cubic functions through discovery and shows how the graph stretches or compresses when the “a” value is changed. Your students will make observations and reflect on the causes and effects of end behaviors when graphing cubic functions.
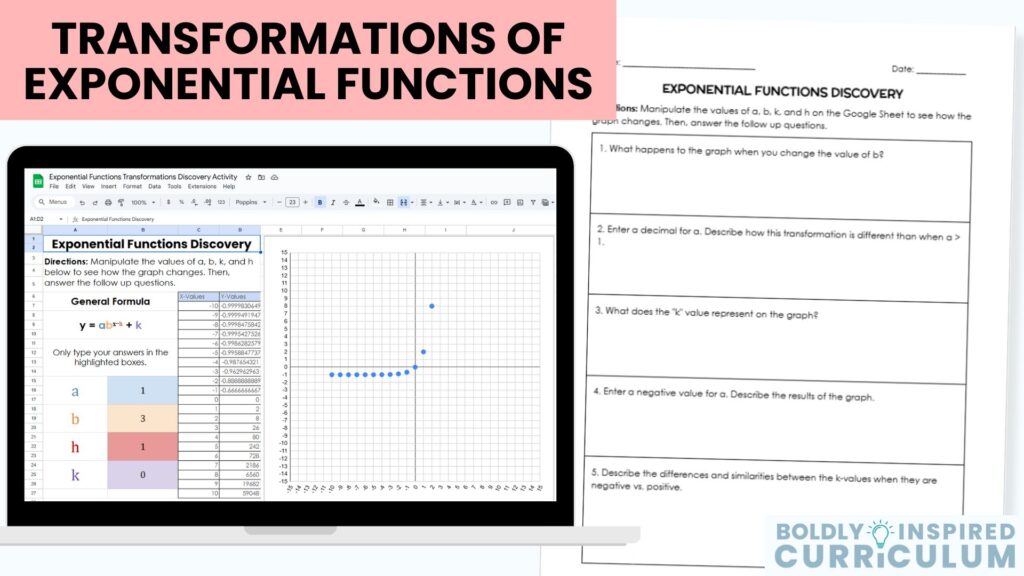
Your students will watch the exponential function transform as they change the values of a, b, h, and k. This activity will help you introduce identifying asymptotes from graphs and equations. You can also open up a discussion about what affects the steepness of the exponential curve.
Help your students understand the effects of changing the slope and y-intercept in a slope-intercept form function. They will analyze the steepness of a graph and make observations about the graph when the y-intercept moves.
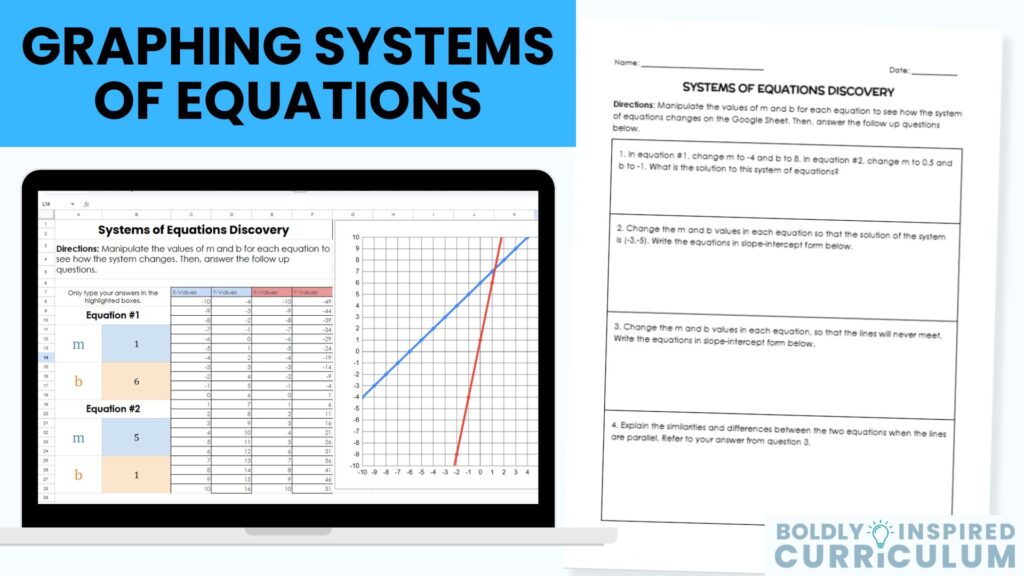
Your students will change the slope and y-intercept values of each equation to see the results in the linear system. They will identify the solution of a linear system from a graph. You can also open up a discussion about the different types of solutions and what that looks like on a graph compared to the equations.
Open-ended Questions and Critical Thinking
Open-ended reflection questions are also included for your students to answer based on their observations of the graph. All of these questions are editable so that you can ask as many questions as you need for your lesson. The Google Sheets version of these questions clearly mark where your students should type their responses.
The follow up questions prompt students to change specific values to observe the outcome. Some examples of questions are:
- Change the value of “h” to a negative number. Describe the results on the graph.
- What happens to the graph when you change the value of “a”?
- Describe the similarities and differences between the k values when they are negative vs. positive.
A printable version of these questions are also included. The function transformations worksheet is a fully editable Google Doc that allows you to change the questions to whatever your learning objectives are that day.
This is the perfect solution if you want to leave this activity with a sub. Your students will be able to make observations on their own, then hand in a physical copy of their responses so the substitute can hold them accountable.
Final Thoughts About These Functions Transformations Activities
Open-ended reflection questions are also included for your students to answer based on their observations of the graph. All of these questions are editable so that you can ask as many questions as you need for your lesson. The Google Sheets version of these questions clearly mark where your students should type their responses.
The follow up questions prompt students to change specific values to observe the outcome. Some examples of questions are:
- Change the value of “h” to a negative number. Describe the results on the graph.
- What happens to the graph when you change the value of “a”?
- Describe the similarities and differences between the k values when they are negative vs. positive.
A printable version of these questions are also included. The function transformations worksheet is a fully editable Google Doc that allows you to change the questions to whatever your learning objectives are that day.
This is the perfect solution if you want to leave this activity with a sub. Your students will be able to make observations on their own, then hand in a physical copy of their responses so the substitute can hold them accountable.